Call William Directly at 248.980.2455
September Real Estate Market Update
Just when we thought the market was going to take a pause, it picked up at an even faster pace. August brought us the highest median and average prices in the past four years, past two years for NW Michigan, as well as the lowest For Sale home inventories and the highest number of sales — all indicators of strengthening buyer demand. So, is this sustainable or just a temporary release of pent up demand? The answer is both; demand is growing both short and long term. Just because values declined since peak 2005 and Sellers were not able to sell, does not mean the reasons that people need to sell stop (births, deaths, divorce, retirement, etc.). The result is a short term build up of demand from six years of sellers holding back as well as a long term buildup as Gen X and Y move into their prime home buying years. So it looks good for us on all fronts, adjusting for the short term economic hiccups we might see (none like what we have gone through in the past six years).
Demand would be even higher if it were not for some industry-wide bottlenecks resulting from both the financial crisis and the sudden growth in demand. A recent economic report predicted that a shortage of staffing in the mortgage industry will hold back sales in the upcoming year which makes sense since in Michigan alone, we peaked at about 5,000 mortgage lenders and now we are in the 300s, with the same number of purchase mortgage applications! (as many of you know, we have been on a hiring push in our Affiliates to get ahead of the staffing issues and give us a competitive edge). Add to that a shortage of listings, issues with appraisal values (which are getting better) and the tough lending standards and it is not surprising buyers can feel frustrated. The silver lining is all of these bottlenecks will go away and release even more buyer demand into the market. In fact a NAR study shows that unreasonable lending standards are holding back up to 700,000 real estate sales this year.
The majority of the market activity is well into the Seller’s Market range. Another telling point is the average days on market. In August, non-bank owned homes selling in the under 90-day category had an average market time of 13 days, while those over 90 days averaged 153 days.
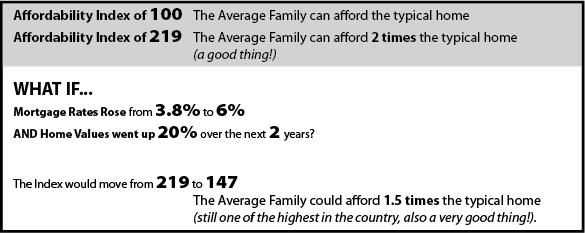
So with all this great news, how much “play” is there in buyer demand if mortgage rates rise and values jump? The housing affordability index is a good way to test the “play.” Here is how the index works:
So we have some room for the real estate market to continue to grow even with rising interest.
In spite of the strong activity, many Sellers are not seeing a benefit. So how does a market look like a Seller’s Market to some and a Buyer’s Market to others at the same time? Here is the math: About 15% of homes are still declining in value (up to 10%), based on condition/location, while another 30% are being overbid (on average 9%) with the remaining sold on average within 5% of asking price. The net result gives us a watered down average appreciation of about 3% when in fact it is the “overbid by 9%” segment that gives a leading indicator of where the market is headed. Keep in mind that the typical home on the market in excess of 90 days is, on average 15% over priced, so to that Seller, it feels like the only way to sell is to take a deep discount.


