
Call William Directly at 248.980.2455
August Real Estate Market Update
Just when you think it can’t get any wilder, it does. July activity hit near record highs and lows – Highs in terms of home sales and lows in terms of low inventories. Again, more listings and buyers entered the market in July so at the end of the month the net result is fewer homes on the market. The feeding frenzy continues to be concentrated on homes on the market for under 90 days (and for the most part, under two weeks) where 90% of all buyers are focusing. The market continues to show that about 40% of the available listings on the market for over 90 days have only 10% of the buyers looking at them. Despite the wild activity, there are still many sellers who don’t feel the love from all those buyers. In most cases, it is because of a combination of condition, location and price (with price being the ultimate fix of the first two).
The big question of the month has been, “What is the impact of Detroit’s bankruptcy filing on the city’s housing demand?” The answer is, as of now, very little. Demand still remains strong, following the rest of the metro area, with median prices rising to a five-year high and multiple bids for many neighborhoods. For the most part, homebuyers and sellers have anticipated some sort of financial change for the city. Although bankruptcy might not have been the ideal solution, it is a solution for moving forward, giving potential homeowners hope for better things to come.
We try to get ahead of where the market is going by tracking the rate of change of the key housing indicators such as new listings, pending sales and listing inventories. Since real estate sales are seasonal (more activity in the summer, less in the winter) we compare the change in any given month, say June of 2013 to that same month the prior year. By charting those changes we can see the speed at which any given indicator is moving. For example, sales may have been up each month, but the amount of increase is less each month, showing the market is still moving up but at an increasingly slower pace. We can anticipate a slower market even though the raw numbers are still going up. This allows us to look forward to see what trends we can expect in the next 3-6 months.
The following pages feature the rate of change trends for New Listings, Pending Sales and Month End Listing Inventories for each county and for the over $500,000 market.
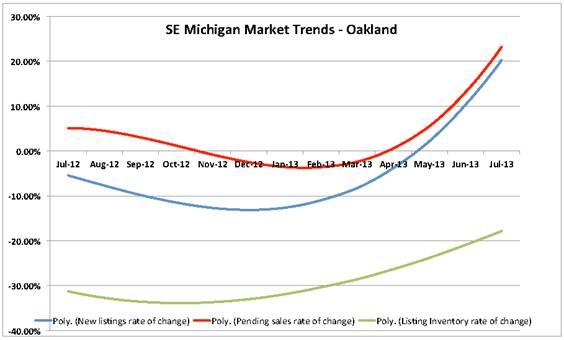
Oakland County – Under $500,000
In this chart, new listings coming on the market (after falling for most of 2012) picked up speed dramatically in 2013. So did pending sales, meaning the buyers gobbled up all the new listings hitting the market, and then some, ultimately driving down the total inventory available for sale each month. However, the Listing Inventory line shows that the rate buyers are eating into the housing inventory is slowing. When the green Listing Inventory line reaches zero, that means buyers are not buying homes as fast as they are coming on the market and listing inventories will begin to rise again.
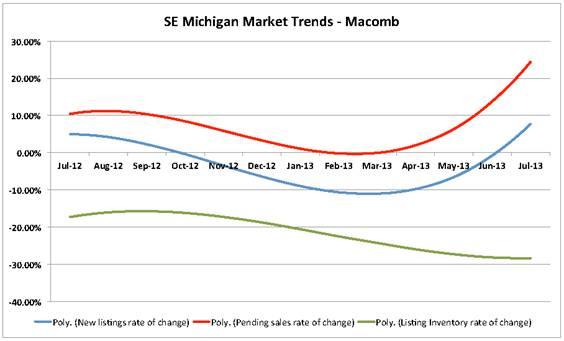
 Macomb County – Under $500,000
Macomb follows the general trend we see in Oakland, but at a slower pace. The rate of increase in Pending Sales is ahead of New Listings, causing Listing Inventories (green line) to continue to fall. Macomb can expect to see more upward pricing pressure than Oakland over the next few months.
 Wayne County – Under $500,000
Wayne follows a trend in-between Oakland and Macomb. Pendings are rising, but the last few months’ inventories have been keeping pace. This shows a recent, but slow, trend towards listings catching up with buyer demand (upward movement of the green line).
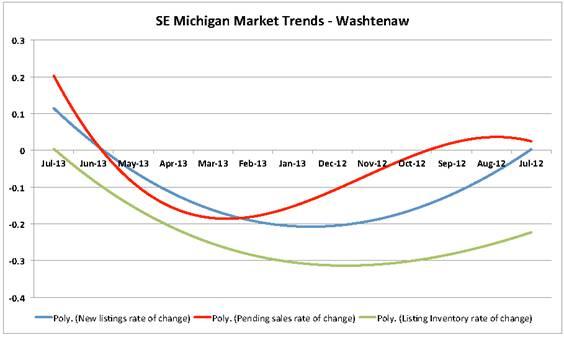
 Washtenaw – Under $500,000
Washtenaw shows the biggest change in market momentum. From March through June, the rate of New Listings entering the market outpaced Pending Sales. So although listings declined, it has been at a much slower pace. Pending Sales jumped up in July, reversing that trend, but overall Washtenaw is the county moving the fastest to a balance between available listings and buyer demand. Since it was the first county to become a Sellers Market, it makes sense that it would be the first to move to equilibrium.
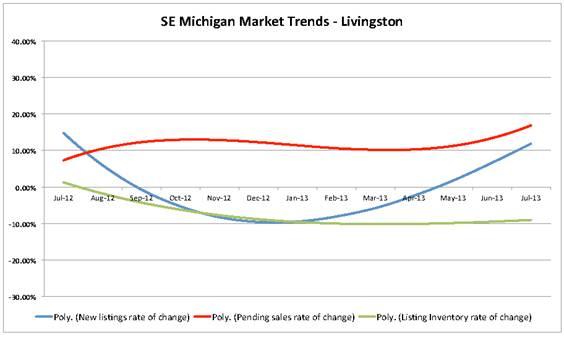
 Livingston County – Under $500,000
The pace of Pending Sales has remained very steady, with a 10% rise over the prior year for most of ‘12 and ‘13. New Listings entering the market were at a declining pace until February, but have since risen to catch up with buyer demand.
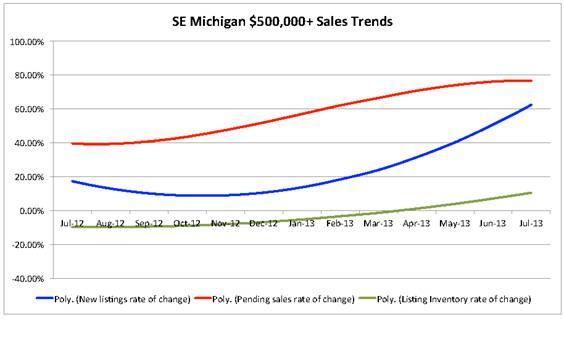
 Home Sales in Excess of $500,000 – 5 County Metro Area
The rate of increase in Pending Sales jumped up in January, as did the rate of increase in New Listings entering the market. Resulting in (since April) the listing inventory for the upper end market rising over last year. Although the trends show the overall increase in activity slowing for the upper end, in markets with large $500,000 segments (like Birmingham/Bloomfield), the upper end demand is still growing. Overall, the market is pretty thin, so a small change in demand or supply will move the numbers up or down quickly.
 About William Brundage – Max Broock Realtors:
Named the Best Realtor by the Oakland Press, William Brundage is an industry leading Realtor bringing over twenty years of experience to successfully marketing and selling fine homes and estates. His dedication to his clients places him in the top 1% nationwide. Personalized service and client satisfaction are paramount. William is committed to getting you the best price and terms in the shortest amount of time.
Cell: 248-980-2455
Email: william@williambrundage.com
Website: www.WilliamBrundage.com


